Facebook’s latest algorithm update(Facebook Zero) will have a significant impact on Social Media Marketing efforts on the platform. In this article, you’ll find out what to expect from the changes and learn how you can best maintain interaction and visibility with audiences on the Facebook news feed.
 Facebook is making significant changes to its news feed algorithm in an effort to prioritize “meaningful” person-to-person interactions among friends and family over posts from Facebook Pages. Facebook has acknowledged that passively consuming articles or videos that don’t spark engagement or interaction is bad for a person’s mood.
While Facebook still values FB Page content as an important part of their platform’s ecosystem, the news feed will shift the focus from ranking content that’s directly consumed from Pages (which will shrink in reach) to content that is shared and talked about among friends (which will grow).
Reducing or eliminating this may be a positive for their user’s experience, but these updates will result in fewer public posts from FB Pages and fewer videos in user’s news feed unless companies and organizations pay to promote that content.
This will continue to cause a decline in referral traffic from Facebook(which is already down over 25%), a topic I discussed in a previous blog post titled: Referral Traffic Trends: Facebook Declines, Google Grows.
Mark Zuckerberg, said this about the planned updates to the news feed:
“As we roll this out, you’ll see less public content like posts from businesses, brands, and media. And the public content you see more will be held to the same standard – it should encourage meaningful interactions between people.”
Organic reach for business pages has been declining for a long time. The Facebook Zero algorithm update just accelerates the decline. The chart on this article clearly shows the decrease in organic reach for page posts since 2012.
Facebook is a for-profit company. As such they are financially motivated to slowly decrease the efficacy of their organic (i.e. FREE) advertising in order to make people move to their paid ad platform.
Google did the same thing in their “search engine results” which drove revenue growth for their AdWords Paid Search Advertising service. In a previous blog post I discussed how this ultimately caused Google to lose market share for product searches on the Internet. Amazon now leads Google in Product Searches.
It is why I(along with the European Union) no longer call Google a search engine. I refer to it as a Paid Placement Advertising Service.
WHAT DO THESE CHANGES MEAN FOR FACEBOOK MARKETERS?
If you rely primarily on organic traffic from Facebook, then the Facebook Zero algorithm is bad news.
As Facebook begins to prioritize content that facilitates meaningful people-to-people connections and interactions, marketers can expect the organic reach of their Facebook pages to drop.
Specifically, users will see more posts from people they’re connected to in the news feed and less content from pages they follow. This is a significant change from the previous values of the news feed, which prioritized the total time spent on Facebook and how many people shared posts directly.
Users will also start seeing less video content in the news feed because it typically generates less conversation, particularly public videos.
Facebook will allow your followers the option to select to see your content first in their News Feed, an option that very few if any users will be able to figure out how to set. It also hints that Groups and Live Video may get a boost with the new update.
WHAT TYPE OF CONTENT WILL GET PRIORITIZED IN THE FEED?
Facebook has stated that Posts that spark and inspire conversations and meaningful interactions among people will be prioritized over public content in the news feed after the update.
Content that is shared and commented on will receive a higher prioritization. Comments are more valuable than Likes. Comments on Content that take time and thought to type out will be a positive ranking signal for the Content.
HOW CAN BUSINESSSE AND ORGANIZATIONS RESPOND TO THESE CHANGES?
Instead of posting everything, businesses and organizations will have to be more strategic about the content they post. They need to create posts that promote meaningful connections and interactions among people. Those will be prioritized in the news feed.
It is also wise for businesses and organizations to utilize additional platforms and strategies for getting their content in front of their target audience. If your business doesn’t have an audience on other platforms… now is the time to build those mechanisms.
I will talk more about that in future posts.
Until then, you may be interested in these related posts: Social Media Content Half Life, Big Data & Psychometric Marketing, Marketing Uplift & Predictive Modeling, and Targeted Marketing Models.
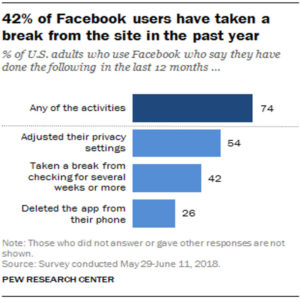 According to Pew Research Facebook users continue to reduce the amount of time they are spending on the platform. Just over half of Facebook users ages 18 and older (54%) say they have adjusted their privacy settings in the past 12 months, according to a new Pew Research Center survey. Around four-in-ten (42%) say they have taken a break from checking the platform for a period of several weeks or more, while around a quarter (26%) say they have deleted the Facebook app from their cellphone. All told, some 74% of Facebook users say they have taken at least one of these three actions in the past year.
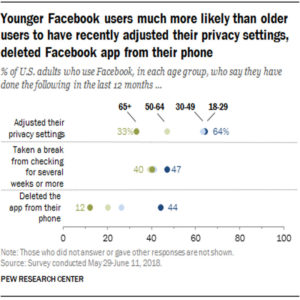 There are, however, age differences in the share of Facebook users who have recently taken some of these actions. Most notably, 44% of younger users (those ages 18 to 29) say they have deleted the Facebook app from their phone in the past year, nearly four times the share of users ages 65 and older (12%) who have done so. Similarly, older users are much less likely to say they have adjusted their Facebook privacy settings in the past 12 months: Only a third of Facebook users 65 and older have done this, compared with 64% of younger users. In earlier research, Pew Research Center has found that a larger share of younger than older adults use Facebook. Still, similar shares of older and younger users have taken a break from Facebook for a period of several weeks or more.

 When you all but eliminated “products” from your organic search results to create demand for your paid placement “Google Shopping” monetization scheme you ceased to be a Search Engine. Instead, you became a Paid Placement Advertising Service. Your index of products available for purchase was reduced to those stores willing to pay you to inlcude their products in your Google Shopping product index.


 Marketing Uplift(aka Marketing Lift) is the difference in response rate between a treated group and a randomized control group.
Recent Comments